Making the physical industrial world machine-readable.
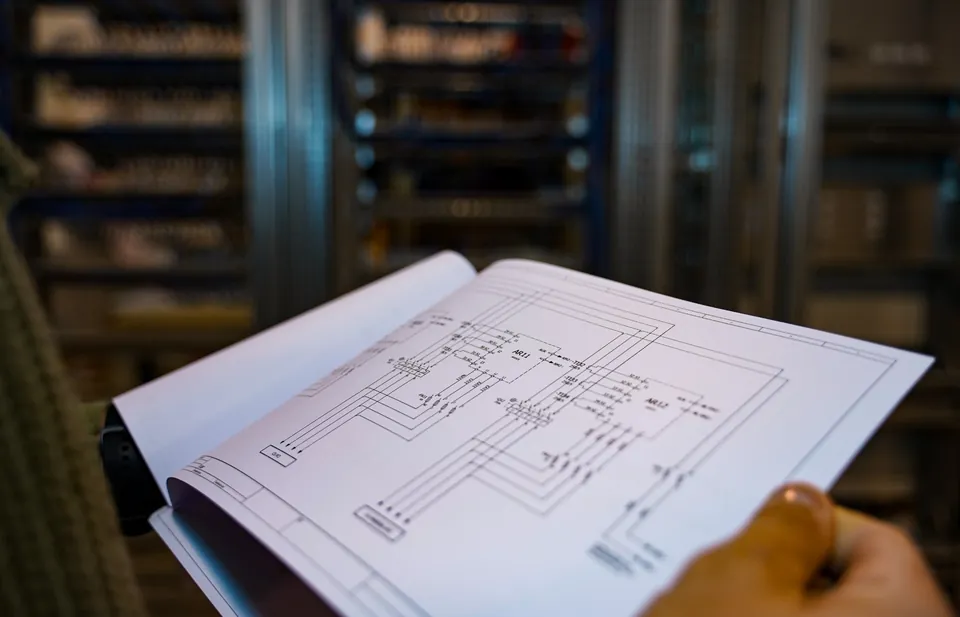
We process your facility’s drawings, registers and scanned documents, in any condition and any language, and build a single structured model of your plant.
- 01AnalyzeP&IDs, equipment registers, datasheets and spreadsheets, in whatever condition they’re in.
- 02ConnectWe link every tag, line and instrument across those documents into one model of the plant.
- 03CheckOur engineers review the model before it enters the record. Anything the drawings disagree on comes back to your team.
Analyze
P&IDs, equipment registers, datasheets and spreadsheets, in whatever condition they’re in.
Connect
We link every tag, line and instrument across those documents into one model of the plant.
Check
Our engineers review the model before it enters the record. Anything the drawings disagree on comes back to your team.
The result is a searchable, connected record of your facility. Every tag is linked to its location, its connections and every document that references it. As your plant changes, the model changes with it, so it stays accurate.
- Search any tagSee where a piece of equipment sits, what it connects to and every drawing it appears on.
- Trace any lineFollow a process line or signal upstream and downstream, across sheets.
- Ask in plain languageQuestions about the plant come back with answers and the drawings behind them.
- Linked to the sourceEach entry points back to the sheet it came from, so it can be checked at a glance.
What bad records cost
30 to 50%
share of engineers’ time spent finding and validating plant information.
$0.5M to $2.5M
typical cost of one extra day of refinery turnaround.
$220,000
average cost of one hour of unplanned downtime in oil and gas.
14 days
how much shorter top performers’ turnarounds run versus average.
Nigeria refining
0
barrels/day installed refining capacity.
Utilization
Where we work
Engagement
Start with one unit.
Once it has proven itself on your own equipment, coverage extends across the facility.
- 01Pick the areaYou choose the unit where outdated records cost your team the most.
- 02DigitizeWe read its drawings, registers and scans, and build the model.
- 03VerifyWe check the model against the site, then hand it over.
- 04Keep it currentCoverage extends across the facility, and an annual subscription keeps it up to date.
Questions
- What do you need from us?
- Whatever records you have: drawings, equipment registers, datasheets and scans, in any condition. Nothing needs to be cleaned up first.
- Does our data leave the site?
- No. Azael runs on a server inside your facility, and your team uses it over the plant network. Documents only leave the site if you choose to enable cloud processing.
- What happens when a drawing is hard to read?
- Our engineers review it against the other documents before it enters the record. If the drawings themselves disagree, it comes back to your team.
- How does the model stay up to date?
- When a drawing is revised or equipment changes on site, the model is updated under your subscription, so it doesn’t drift out of date again.
- What kinds of facilities do you work with?
- Refineries, offshore platforms, petrochemical and chemical plants, power plants, pipelines and storage terminals.